Getting started with CanISO
A short introduction using this web site
CanISO provides large-scale transcriptome data that obtained by whole transcriptome sequencing (RNA-seq) in normal and tumor conditions for domestic dogs. Furthermore, it also contains germline SNP data that obtained by whole exome sequencing (WES) in normal blood samples. We arranged three menus on the top of CanISO web page to show the transcriptome and SNP data as following: i) Sample data, ii) Transcriptome data, and iii) SNP data.
1. "Sample data" page
There are three kinds of samples in CanISO database: i) some samples have transcriptome data in both conditions and SNP data in normal condition; ii) other samples have transcriptome data in tumor condition and SNP data in normal condition; and iii) the remained samples have only SNP data in normal condition (Fig. 1).
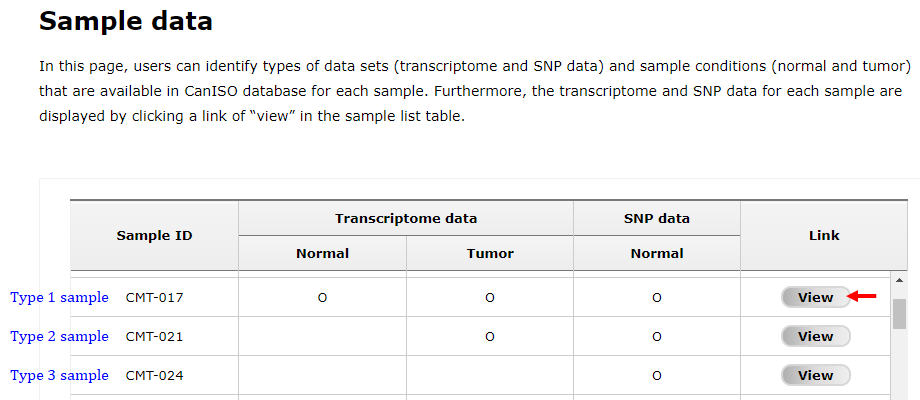
Fig. 1. A screen showing sample list table in "Sample data" page
As shown in Fig. 2, users can see transcriptome and/or SNP data of a gene for normal and/or tumor conditions in a new window that appeared by clicking a "View" button in sample list table (an arrow in Fig 1), in which there are two tabs ("Transcriptome data" and "SNP data" as pointed with red arrows) showing gene information (a), gene-level expression represented in transcript per million (TPM) (b), transcript-level expression in TPM (c), and SNP data (d) for a given gene of the selected sample. In default, the page shows the data for ERBB2 gene (ENSCAFG00000016351, 403883), but user can change to another gene using search function on the top of the page (red box). Note that novel transcripts were identified by analyzing RNA-seq data in normal and tumor conditions, of which names are started with "NORMAL" and "TUMOR" as prefixes, respectively.
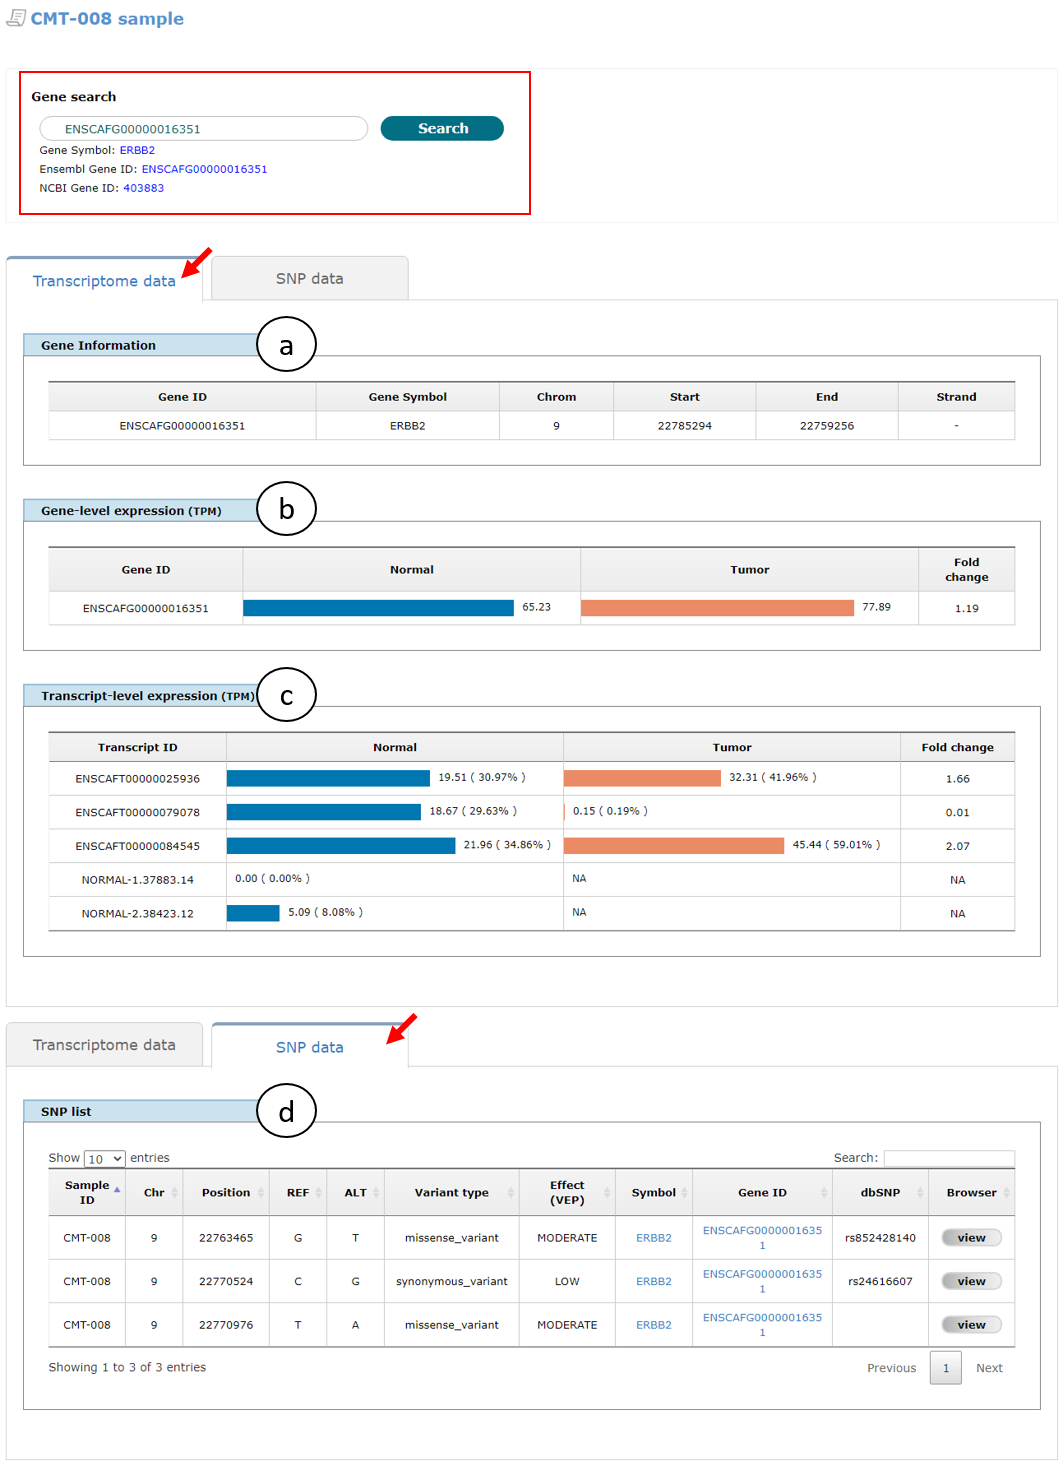
Fig. 2. An example page showing transcriptome and SNP data of CMT-008 sample
2. "Transcriptome data" page
Search function in "Transcriptome data" page support to not only show the data with a gene of interest in normal or tumor conditions (See below 2-1 subsection) but also compare the data between normal and tumor conditions, and dog and human species (See below 2-2 and 2-3 subsections, respectively).
2-1. Simple search
To use simple search function, users should (1) select a sample type (normal or tumor), (2-1) provide a gene of interest, and (3) select a match type (exact match or include the keyword) as shown in Fig. 3. This function accepts "Gene symbol," "Ensembl Gene ID," and "NCBI Gene ID" as keywords. When users provided a keyword with more than 2 letters by direct typing into input box (2-2), related terms started with the keyword will be appeared under the input box for user convenience in this function. There are three example keywords below the input box and clicking one of them will enter it into the input box. In addition, users can reset search settings by clicking "Reset" button on the right-top corner (4).
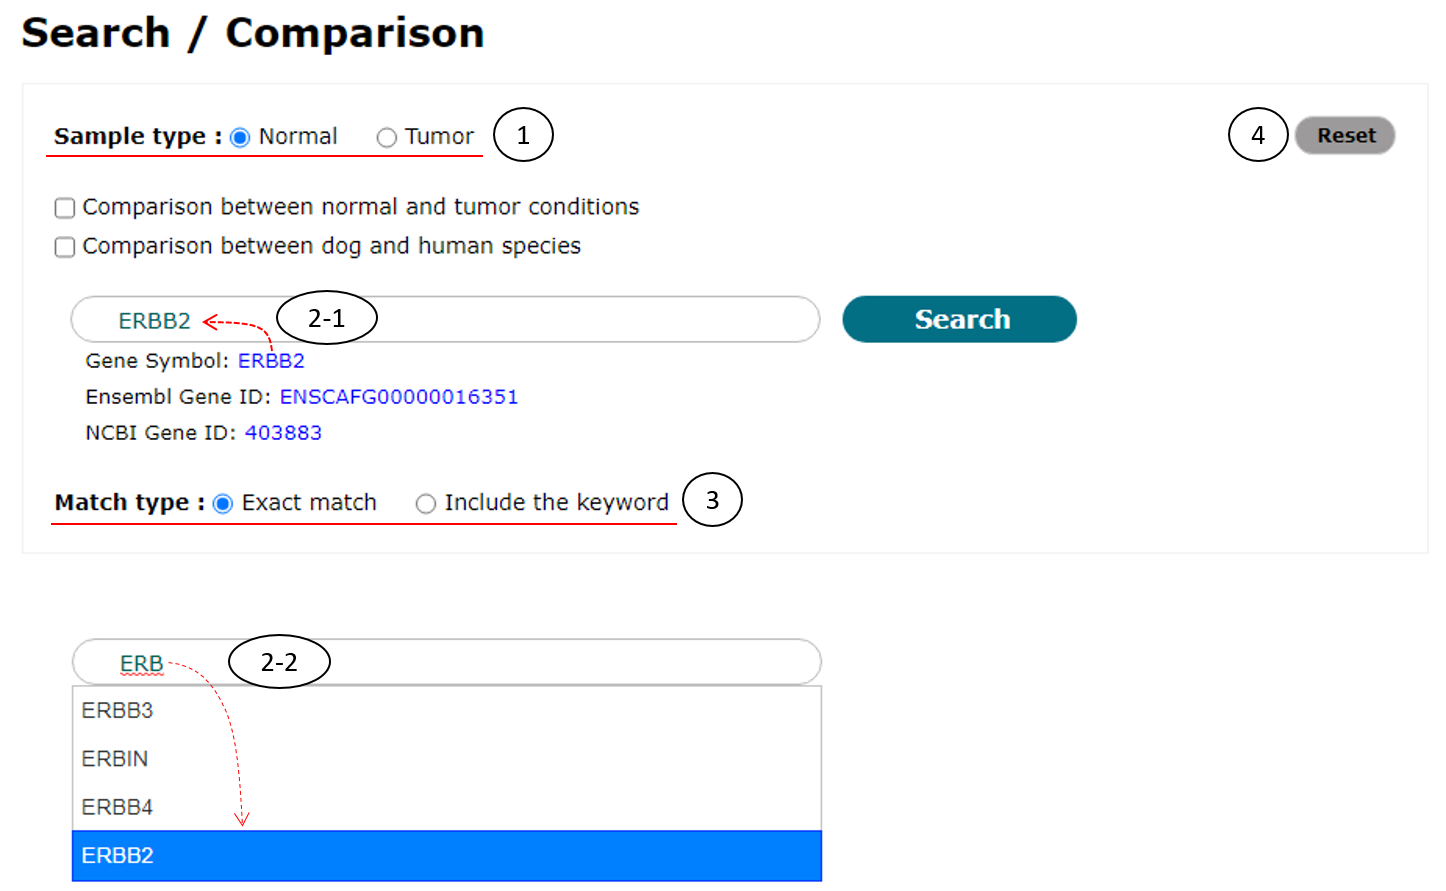
Fig. 3. An example for simple search
Fig. 4 shows the example result page for simple search of ERBB2 (ENSCAFG00000016351) gene in normal condition, in which gene information (a), gene-level expression represented as box plot (b), transcript information (c), transcript structure supporting zoom-in and -out functions (d), transcript-level expression for all transcript isoforms in the gene (e), and ratio of expression levels of the isoforms represented in median TPM (f) are displayed. In addition, alternative splicing patterns of the gene searched can be appeared by clicking "View alternative splicing patterns" button (left-bottom corner of d; See below for details).
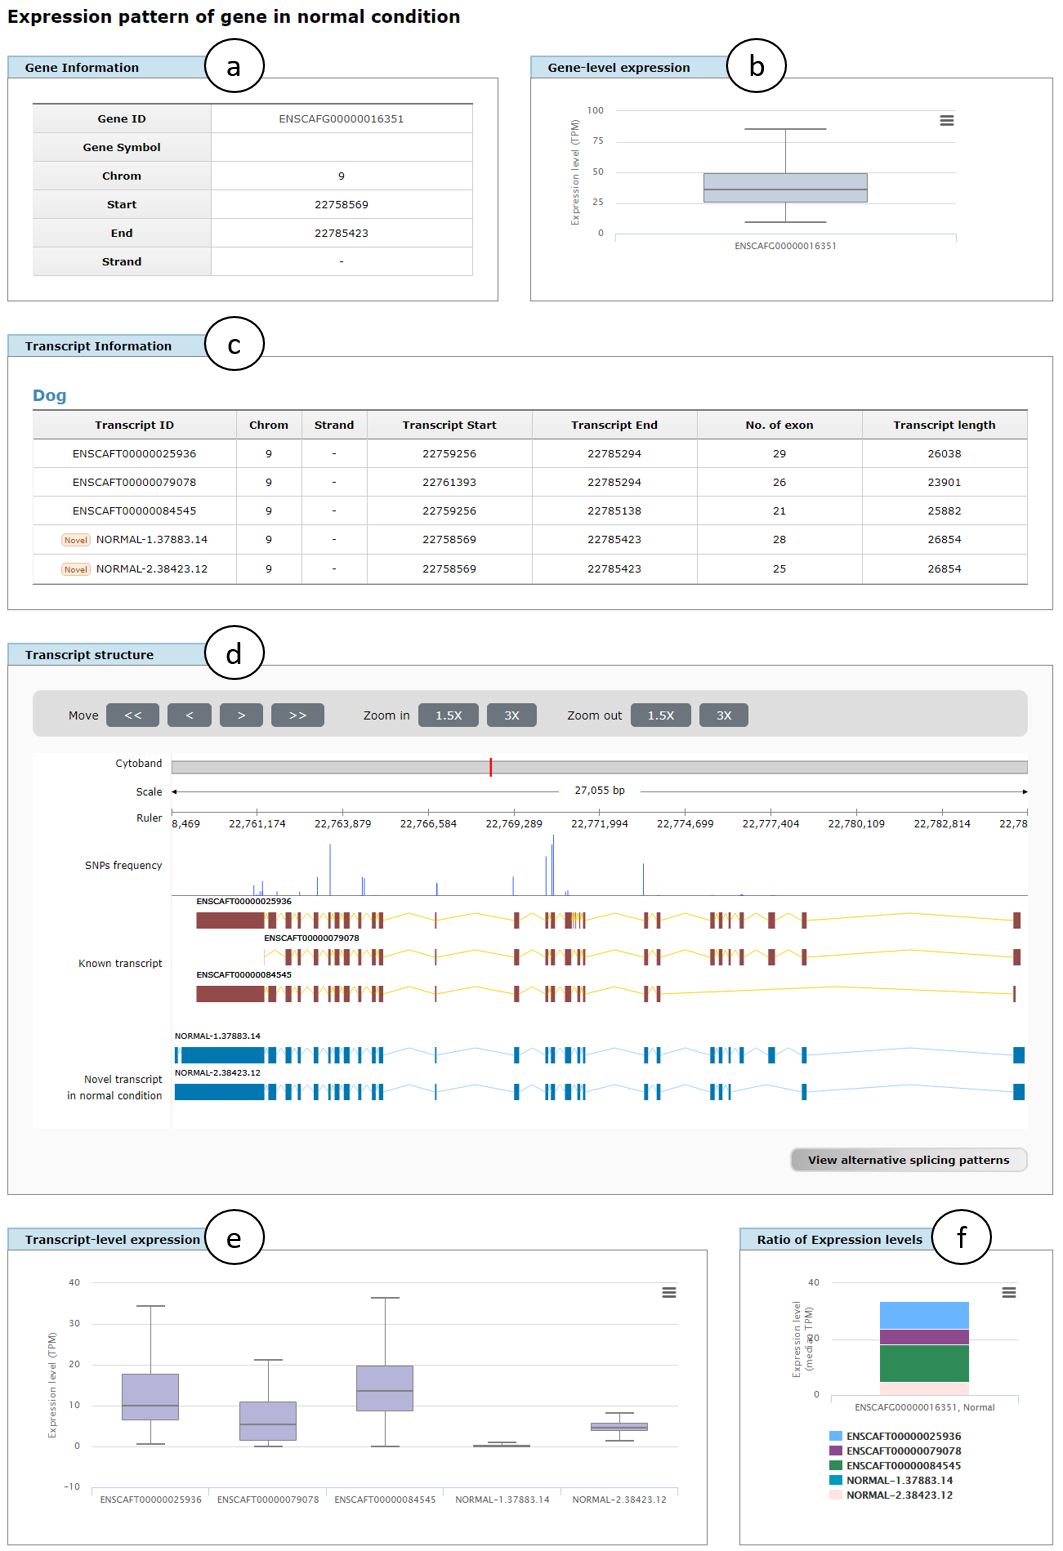
Fig. 4. An example page showing transcriptome data for simple search of ERBB2 gene in normal condition
Fig. 5 shows alternative splicing patterns of ERBB2 (ENSCAFG00000016351) gene in normal condition, which includes alternative promoters (APR), alternative polyadenylations (APA), alternative 5' splicing sites (A5SS), alternative 3' splicing sites (A3SS), cassette exons (skipping exons; CE), cryptic exons (CRE), retained introns (RI), cryptic introns (CRI), and mutually exclusive exons (ME). The patterns were divided into three groups (a, between known transcript isoforms; b, between known and novel isoforms; and c, between novel isoforms) to show different splicing patterns among the groups. Users can view the patterns in plain text by clicking "View data in plain text" button (right-top of a) and also download them as a text file by clicking "Download" button (right-top corner of d).
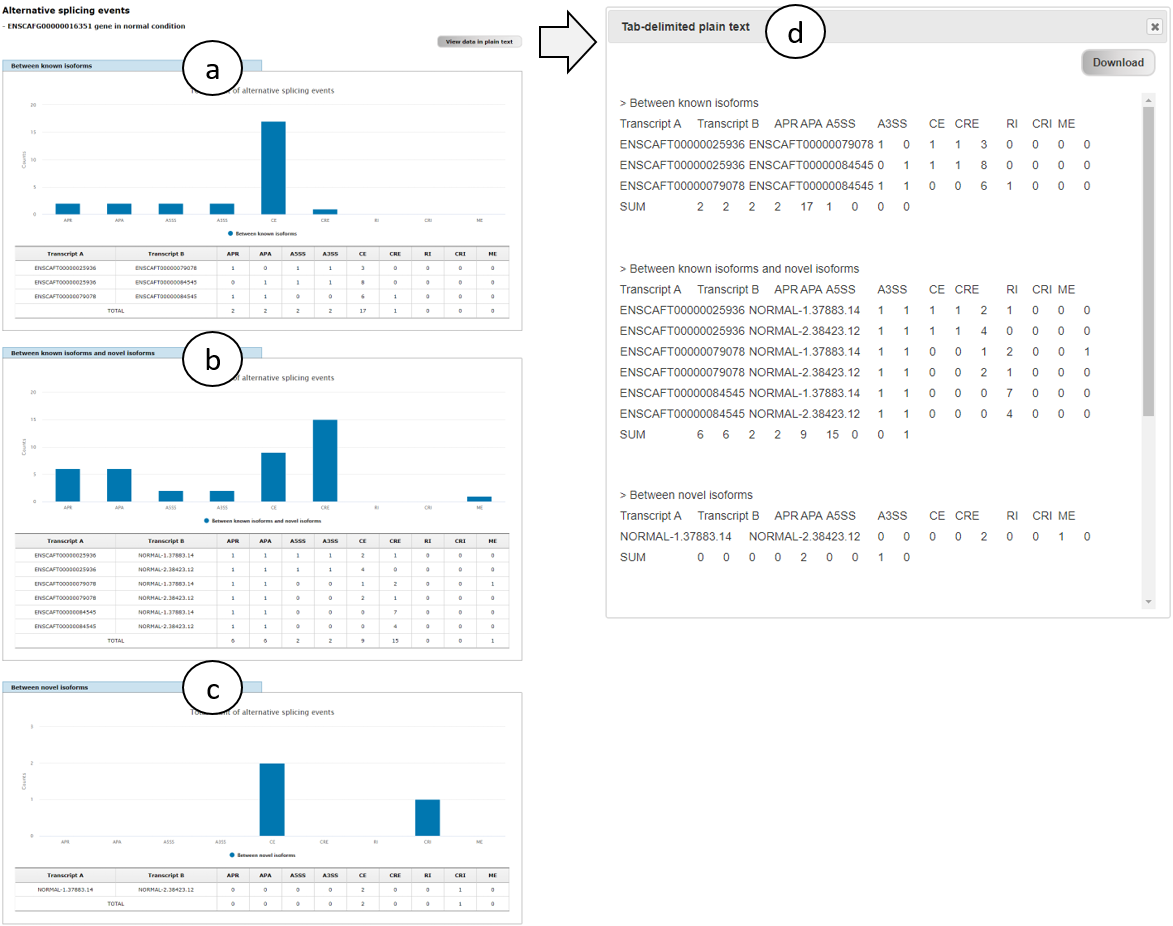
Fig. 5. An example page showing alternative splicing patterns of ERBB2 gene in normal condition
2-2. Comparison between normal and tumor conditions
As shown in Fig. 6, to use this function, users should check the checkbox of "Comparison between normal and tumor conditions" (1). Next steps (2 and 3) are the same with the case of simple search (See Fig. 3).
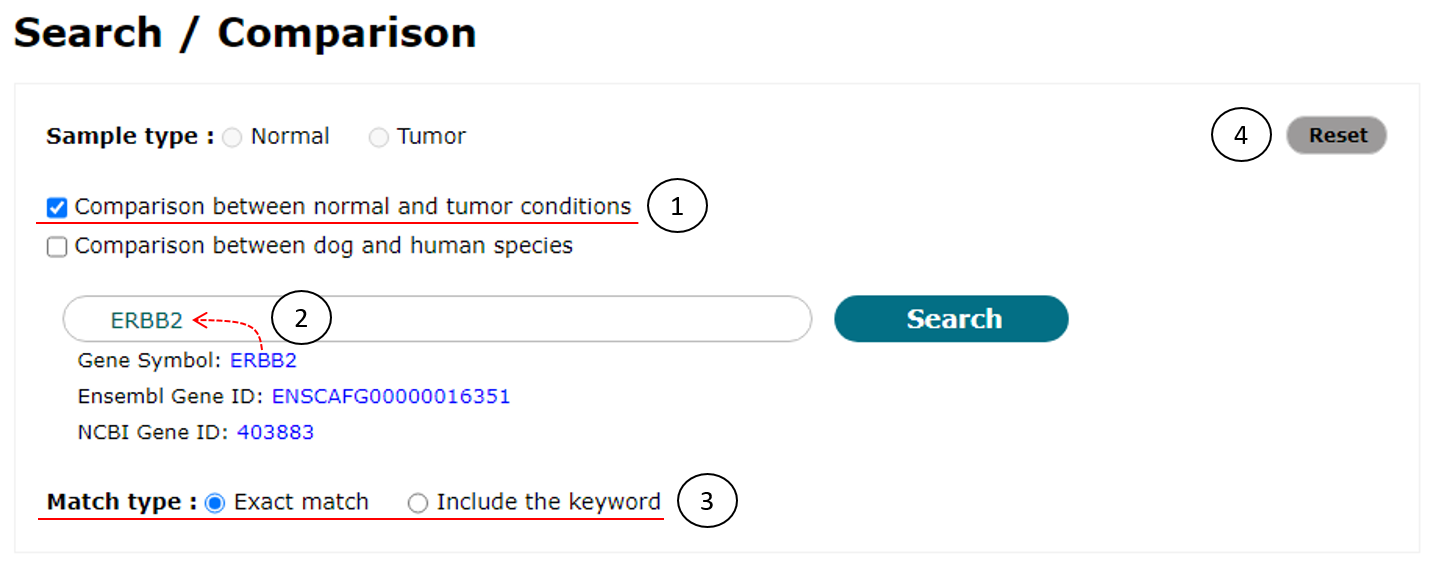
Fig. 6. An example to compare transcriptome data between normal and tumor conditions
Fig. 7 shows an example comparison page of transcriptome data between normal and tumor conditions for ERBB2 (ENSCAFG00000016351) gene, in which gene information (a), gene-level expression represented in median TPM between normal and tumor conditions (b), transcript information (c), transcript structure (d), and transcript-level expression represented in median TPM for all transcript isoforms in the gene between both conditions (e). Fold change shows the change of expression levels from normal to tumor conditions in two panels of gene- and transcript-level expression. Note that if one of novel isoforms was not detected in a certain condition, expression level and fold change of the isoform are represented to NA (Not available).
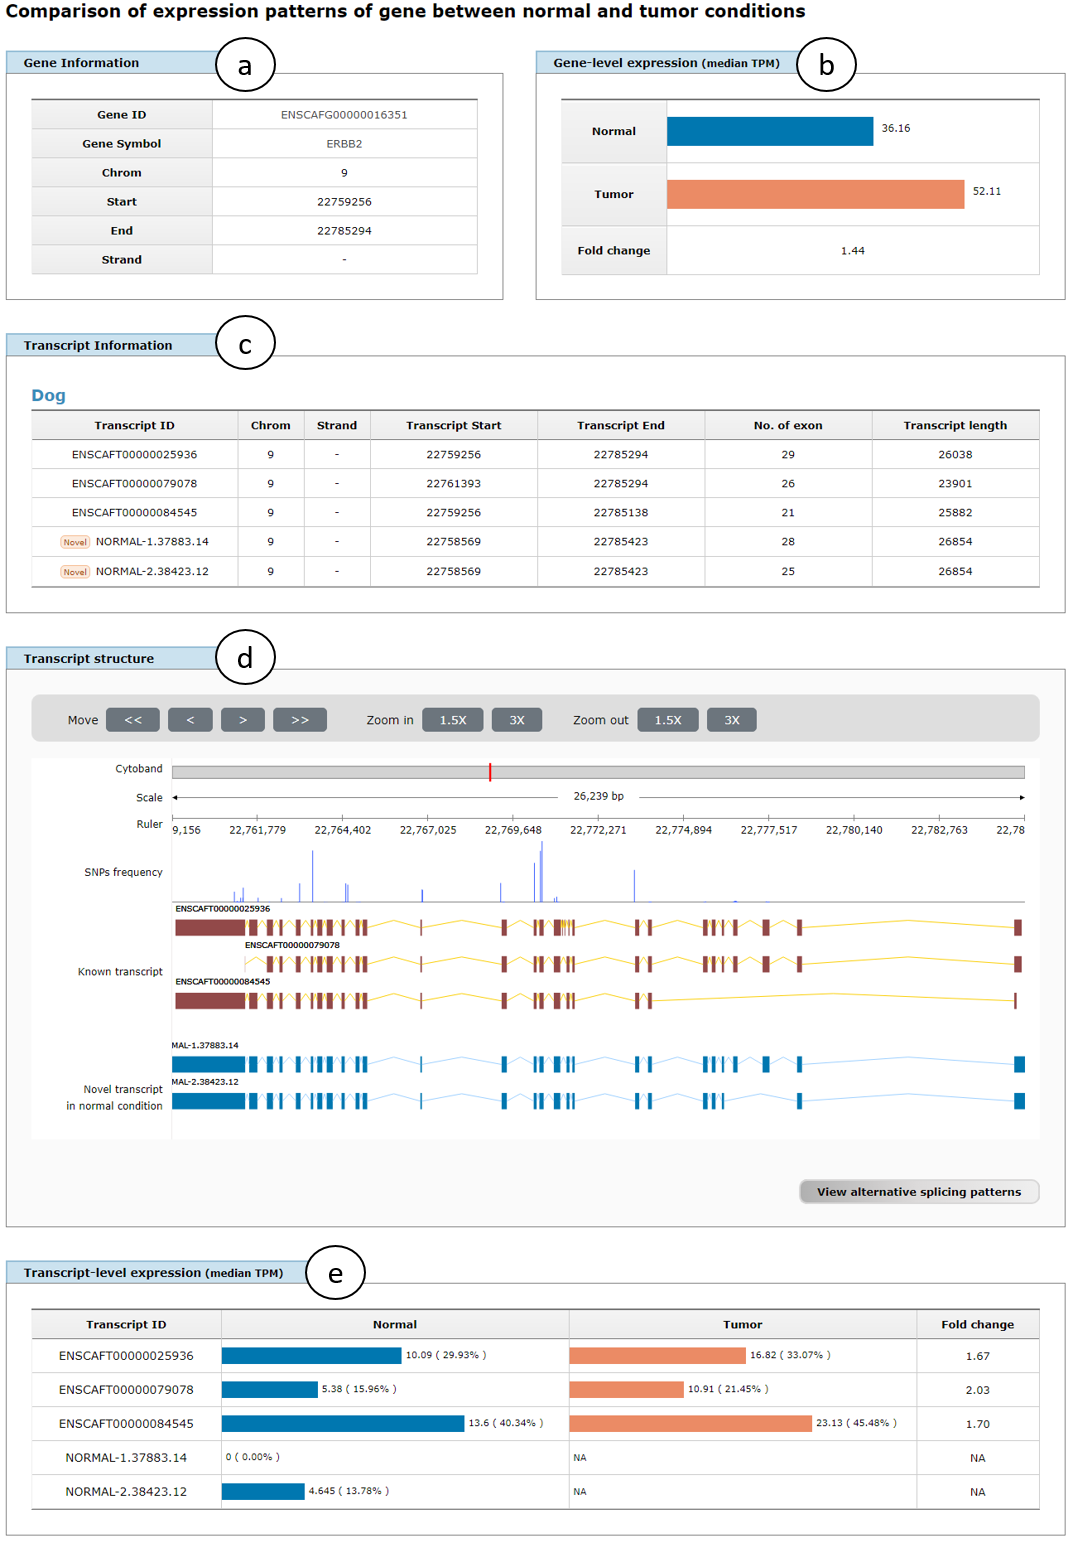
Fig. 7. An example page showing comparison results of transcriptome data between normal and tumor conditions
Fig. 8 shows alternative splicing patterns of ERBB2 (ENSCAFG00000016351) gene in normal and tumor conditions, where splicing patterns of three groups (a, b, and c) are positioned in the same row for comparison of the patters between both conditions. Because of the same composition of known transcripts, splicing patterns between them are the same between both conditions (a). Note that if there is no novel transcripts identified in a certain condition, splicing patterns between known and novel isoforms and between novel isoforms are represented to "None" (b and c in tumor condition). As already mentioned in Fig. 5, view in plain text and download function of the results of splicing patters are also supported (d).
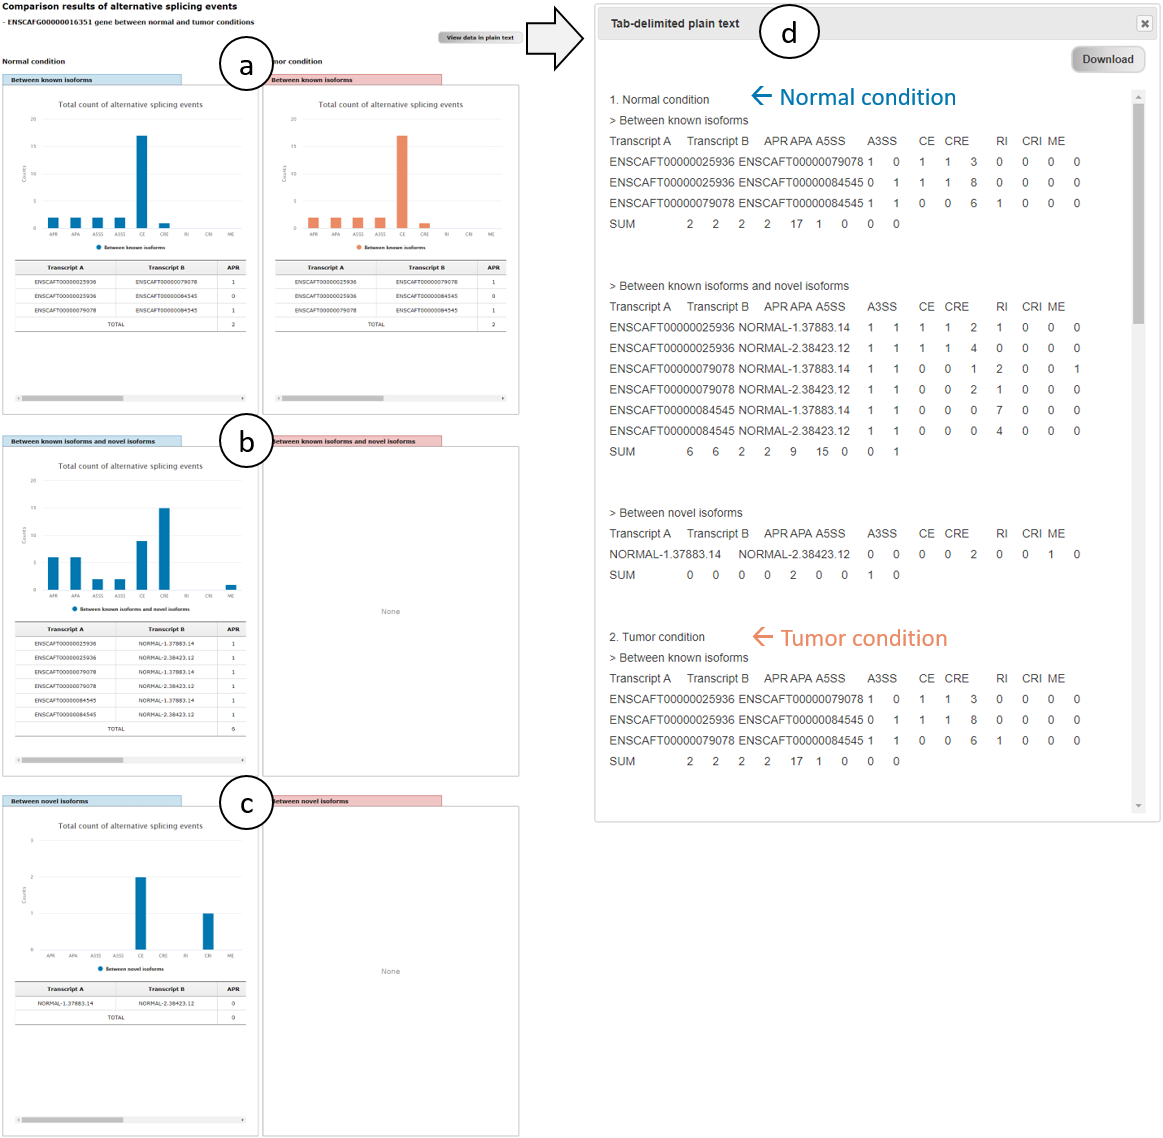
Fig. 8. An example page showing alternative splicing patterns of ERBB2 gene in normal and tumor conditions
2-3. Comparison between dog and human species
As shown in Fig. 9, to use this function, users have to check the checkbox of "Comparison between dog and human species" (1). Next steps (2 and 3) are the same with the case of simple search (See Fig. 3).
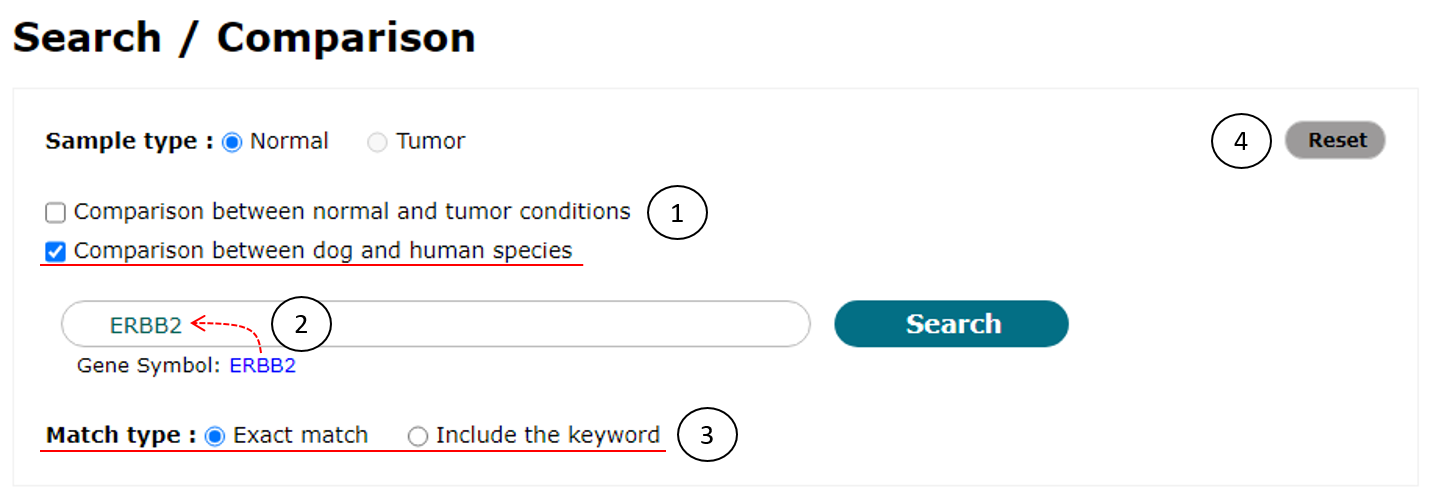
Fig. 9. An example to compare transcriptome data between dog and human species
Fig. 10 shows an example page showing comparison results of transcriptome data between dog and human species for ERBB2 gene, in which gene information (a), gene-level expression represented in median TPM between both species (b), transcript information (c), transcript structure (d), and transcript-level expression represented in median TPM for all transcript isoforms in the gene between both species (e) will be displayed similar to the result page of the comparison of dog transcriptome data between normal and tumor conditions as shown in Fig. 7.
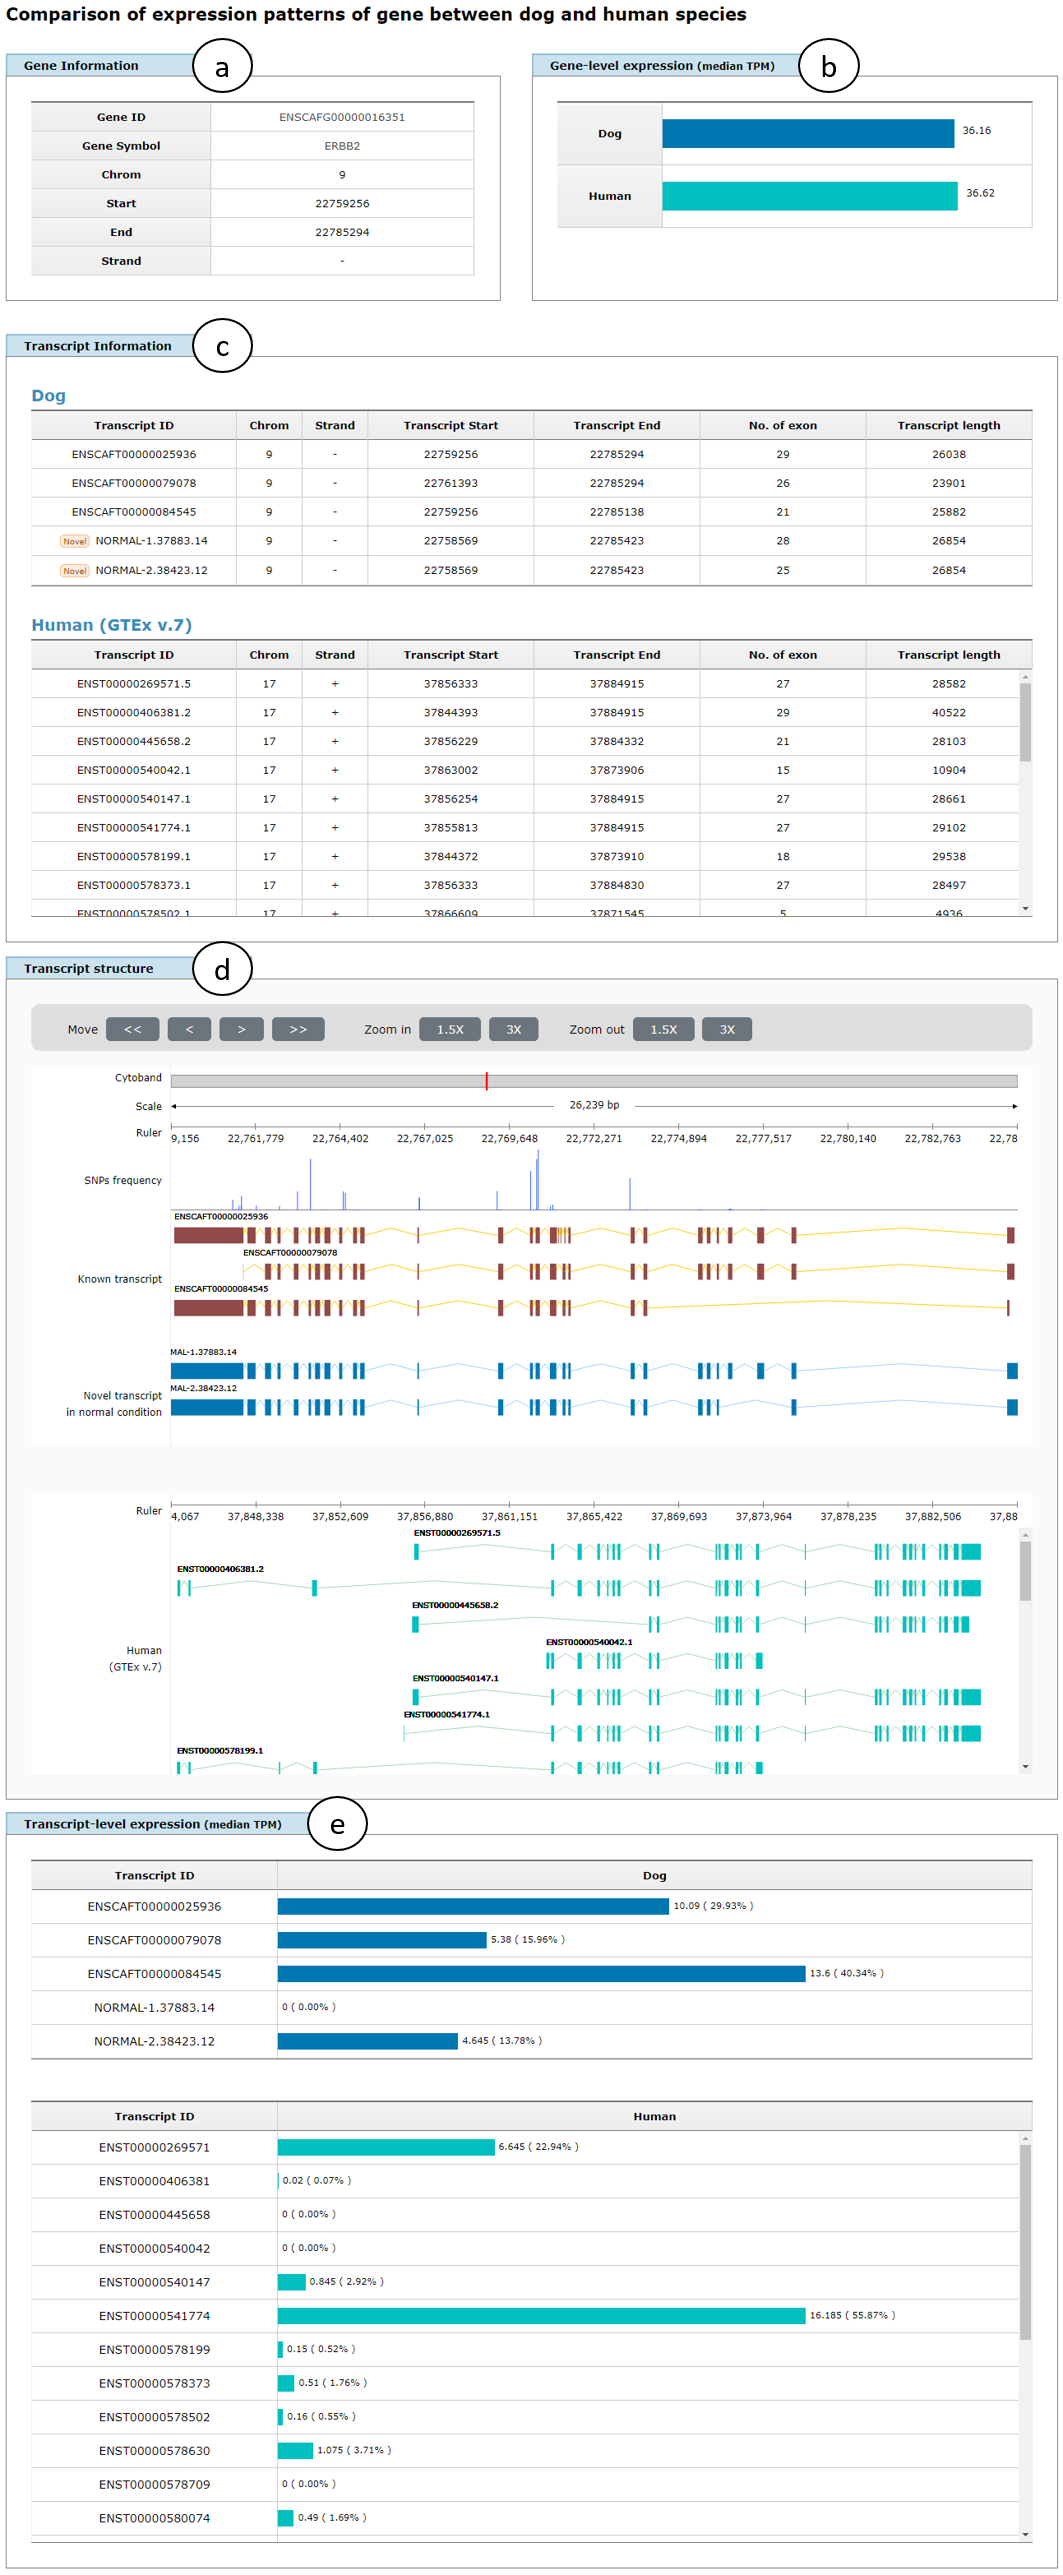
Fig. 10. An example page showing comparison results of transcriptome data between dog and human species
3. "SNP data" page
"SNP data" search function accepts "Gene symbol," "Chromosomal location," "dbSNP ID," or "Sample ID" as keywords. So users should provide a gene keyword of them (1 of Fig. 9). There are four example keywords below the input box and clicking one of them will enter it into the input box.
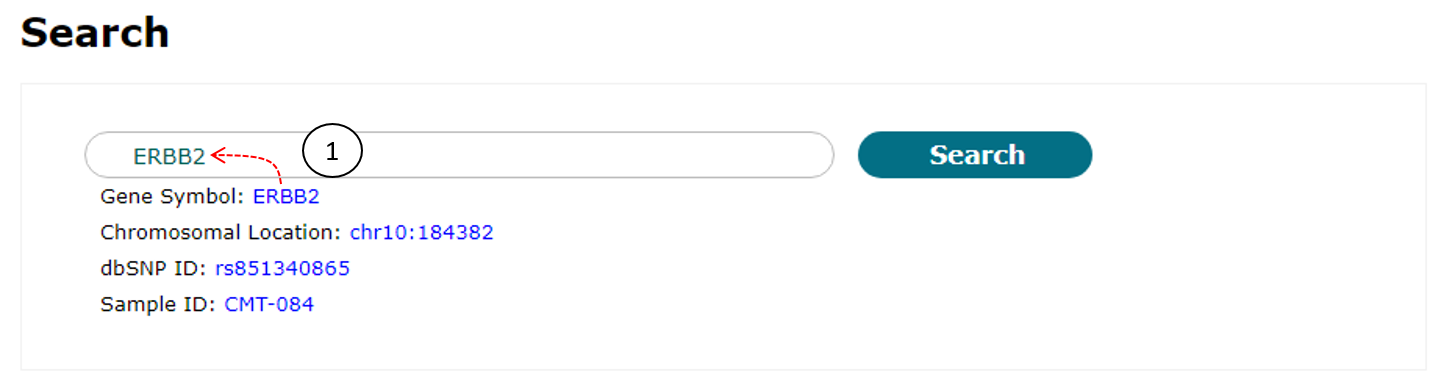
Fig. 11. An example for SNP data search
Fig. 12 shows a table containing SNP list of ERBB2 gene and demonstrates some convenient functions. The table contains several SNP information including Sample ID, chromosomal location, and so on. In the table, the SNPs can be sorted by clicking column names and external web pages will be appeared by clicking the gene symbol and ID. Furthermore, users can further search within the results by typing a keyword into input box (red box on the top of a) to see more specific results (b). The original search results (a) can be restored by removing the entered keyword by clicking "x" icon (red box on the top of b). Users can also see locations and frequencies of the selected and nearby SNPs on the internal genome browser (c) by clicking a "view" button in the SNP list table (red box in the right-most column of a).
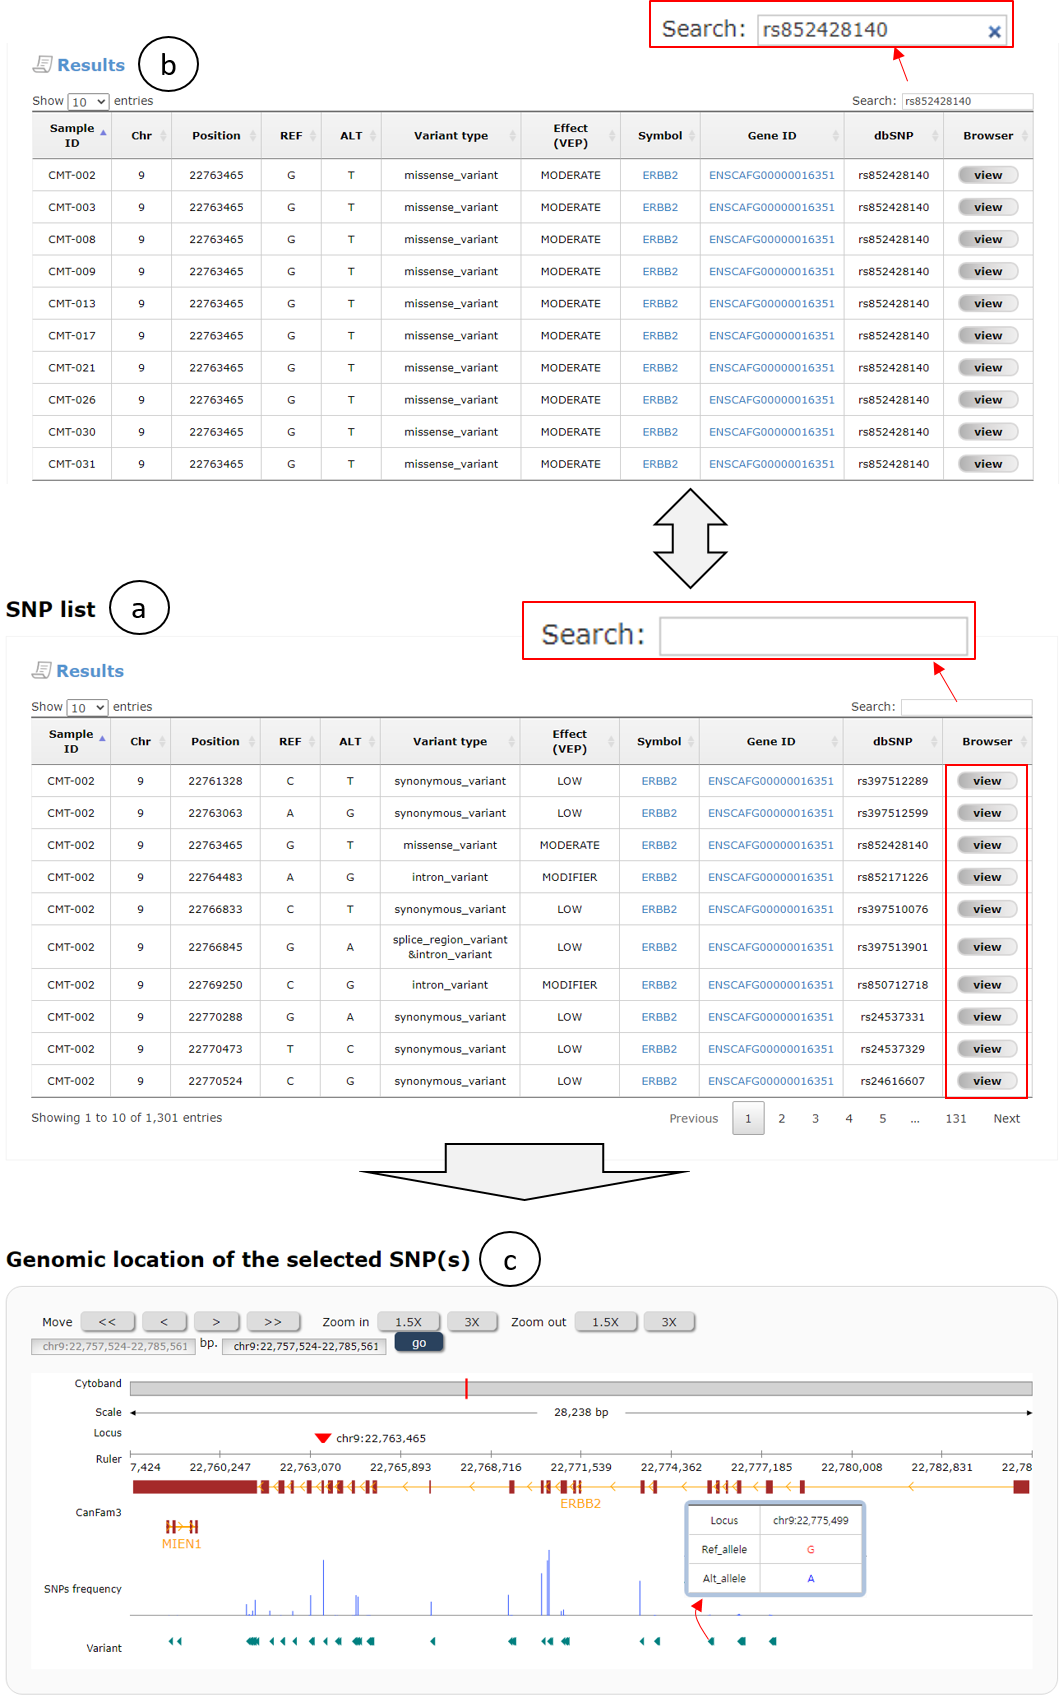
Fig. 12. An example page for SNP data search
CanISO provides large-scale transcriptome data that obtained by whole transcriptome sequencing (RNA-seq) in normal and tumor conditions for domestic dogs. Furthermore, it also contains germline SNP data that obtained by whole exome sequencing (WES) in normal blood samples. We arranged three menus on the top of CanISO web page to show the transcriptome and SNP data as following: i) Sample data, ii) Transcriptome data, and iii) SNP data.
1. "Sample data" page
There are three kinds of samples in CanISO database: i) some samples have transcriptome data in both conditions and SNP data in normal condition; ii) other samples have transcriptome data in tumor condition and SNP data in normal condition; and iii) the remained samples have only SNP data in normal condition (Fig. 1).
Fig. 1. A screen showing sample list table in "Sample data" page
As shown in Fig. 2, users can see transcriptome and/or SNP data of a gene for normal and/or tumor conditions in a new window that appeared by clicking a "View" button in sample list table (an arrow in Fig 1), in which there are two tabs ("Transcriptome data" and "SNP data" as pointed with red arrows) showing gene information (a), gene-level expression represented in transcript per million (TPM) (b), transcript-level expression in TPM (c), and SNP data (d) for a given gene of the selected sample. In default, the page shows the data for ERBB2 gene (ENSCAFG00000016351, 403883), but user can change to another gene using search function on the top of the page (red box). Note that novel transcripts were identified by analyzing RNA-seq data in normal and tumor conditions, of which names are started with "NORMAL" and "TUMOR" as prefixes, respectively.
Fig. 2. An example page showing transcriptome and SNP data of CMT-008 sample
2. "Transcriptome data" page
Search function in "Transcriptome data" page support to not only show the data with a gene of interest in normal or tumor conditions (See below 2-1 subsection) but also compare the data between normal and tumor conditions, and dog and human species (See below 2-2 and 2-3 subsections, respectively).
2-1. Simple search
To use simple search function, users should (1) select a sample type (normal or tumor), (2-1) provide a gene of interest, and (3) select a match type (exact match or include the keyword) as shown in Fig. 3. This function accepts "Gene symbol," "Ensembl Gene ID," and "NCBI Gene ID" as keywords. When users provided a keyword with more than 2 letters by direct typing into input box (2-2), related terms started with the keyword will be appeared under the input box for user convenience in this function. There are three example keywords below the input box and clicking one of them will enter it into the input box. In addition, users can reset search settings by clicking "Reset" button on the right-top corner (4).
Fig. 3. An example for simple search
Fig. 4 shows the example result page for simple search of ERBB2 (ENSCAFG00000016351) gene in normal condition, in which gene information (a), gene-level expression represented as box plot (b), transcript information (c), transcript structure supporting zoom-in and -out functions (d), transcript-level expression for all transcript isoforms in the gene (e), and ratio of expression levels of the isoforms represented in median TPM (f) are displayed. In addition, alternative splicing patterns of the gene searched can be appeared by clicking "View alternative splicing patterns" button (left-bottom corner of d; See below for details).
Fig. 4. An example page showing transcriptome data for simple search of ERBB2 gene in normal condition
Fig. 5 shows alternative splicing patterns of ERBB2 (ENSCAFG00000016351) gene in normal condition, which includes alternative promoters (APR), alternative polyadenylations (APA), alternative 5' splicing sites (A5SS), alternative 3' splicing sites (A3SS), cassette exons (skipping exons; CE), cryptic exons (CRE), retained introns (RI), cryptic introns (CRI), and mutually exclusive exons (ME). The patterns were divided into three groups (a, between known transcript isoforms; b, between known and novel isoforms; and c, between novel isoforms) to show different splicing patterns among the groups. Users can view the patterns in plain text by clicking "View data in plain text" button (right-top of a) and also download them as a text file by clicking "Download" button (right-top corner of d).
Fig. 5. An example page showing alternative splicing patterns of ERBB2 gene in normal condition
2-2. Comparison between normal and tumor conditions
As shown in Fig. 6, to use this function, users should check the checkbox of "Comparison between normal and tumor conditions" (1). Next steps (2 and 3) are the same with the case of simple search (See Fig. 3).
Fig. 6. An example to compare transcriptome data between normal and tumor conditions
Fig. 7 shows an example comparison page of transcriptome data between normal and tumor conditions for ERBB2 (ENSCAFG00000016351) gene, in which gene information (a), gene-level expression represented in median TPM between normal and tumor conditions (b), transcript information (c), transcript structure (d), and transcript-level expression represented in median TPM for all transcript isoforms in the gene between both conditions (e). Fold change shows the change of expression levels from normal to tumor conditions in two panels of gene- and transcript-level expression. Note that if one of novel isoforms was not detected in a certain condition, expression level and fold change of the isoform are represented to NA (Not available).
Fig. 7. An example page showing comparison results of transcriptome data between normal and tumor conditions
Fig. 8 shows alternative splicing patterns of ERBB2 (ENSCAFG00000016351) gene in normal and tumor conditions, where splicing patterns of three groups (a, b, and c) are positioned in the same row for comparison of the patters between both conditions. Because of the same composition of known transcripts, splicing patterns between them are the same between both conditions (a). Note that if there is no novel transcripts identified in a certain condition, splicing patterns between known and novel isoforms and between novel isoforms are represented to "None" (b and c in tumor condition). As already mentioned in Fig. 5, view in plain text and download function of the results of splicing patters are also supported (d).
Fig. 8. An example page showing alternative splicing patterns of ERBB2 gene in normal and tumor conditions
2-3. Comparison between dog and human species
As shown in Fig. 9, to use this function, users have to check the checkbox of "Comparison between dog and human species" (1). Next steps (2 and 3) are the same with the case of simple search (See Fig. 3).
Fig. 9. An example to compare transcriptome data between dog and human species
Fig. 10 shows an example page showing comparison results of transcriptome data between dog and human species for ERBB2 gene, in which gene information (a), gene-level expression represented in median TPM between both species (b), transcript information (c), transcript structure (d), and transcript-level expression represented in median TPM for all transcript isoforms in the gene between both species (e) will be displayed similar to the result page of the comparison of dog transcriptome data between normal and tumor conditions as shown in Fig. 7.
Fig. 10. An example page showing comparison results of transcriptome data between dog and human species
3. "SNP data" page
"SNP data" search function accepts "Gene symbol," "Chromosomal location," "dbSNP ID," or "Sample ID" as keywords. So users should provide a gene keyword of them (1 of Fig. 9). There are four example keywords below the input box and clicking one of them will enter it into the input box.
Fig. 11. An example for SNP data search
Fig. 12 shows a table containing SNP list of ERBB2 gene and demonstrates some convenient functions. The table contains several SNP information including Sample ID, chromosomal location, and so on. In the table, the SNPs can be sorted by clicking column names and external web pages will be appeared by clicking the gene symbol and ID. Furthermore, users can further search within the results by typing a keyword into input box (red box on the top of a) to see more specific results (b). The original search results (a) can be restored by removing the entered keyword by clicking "x" icon (red box on the top of b). Users can also see locations and frequencies of the selected and nearby SNPs on the internal genome browser (c) by clicking a "view" button in the SNP list table (red box in the right-most column of a).
Fig. 12. An example page for SNP data search