메뉴 바로가기 본문 바로가기 하단 바로가기

Korea Bioinformation Center

National center for biological research resources and information

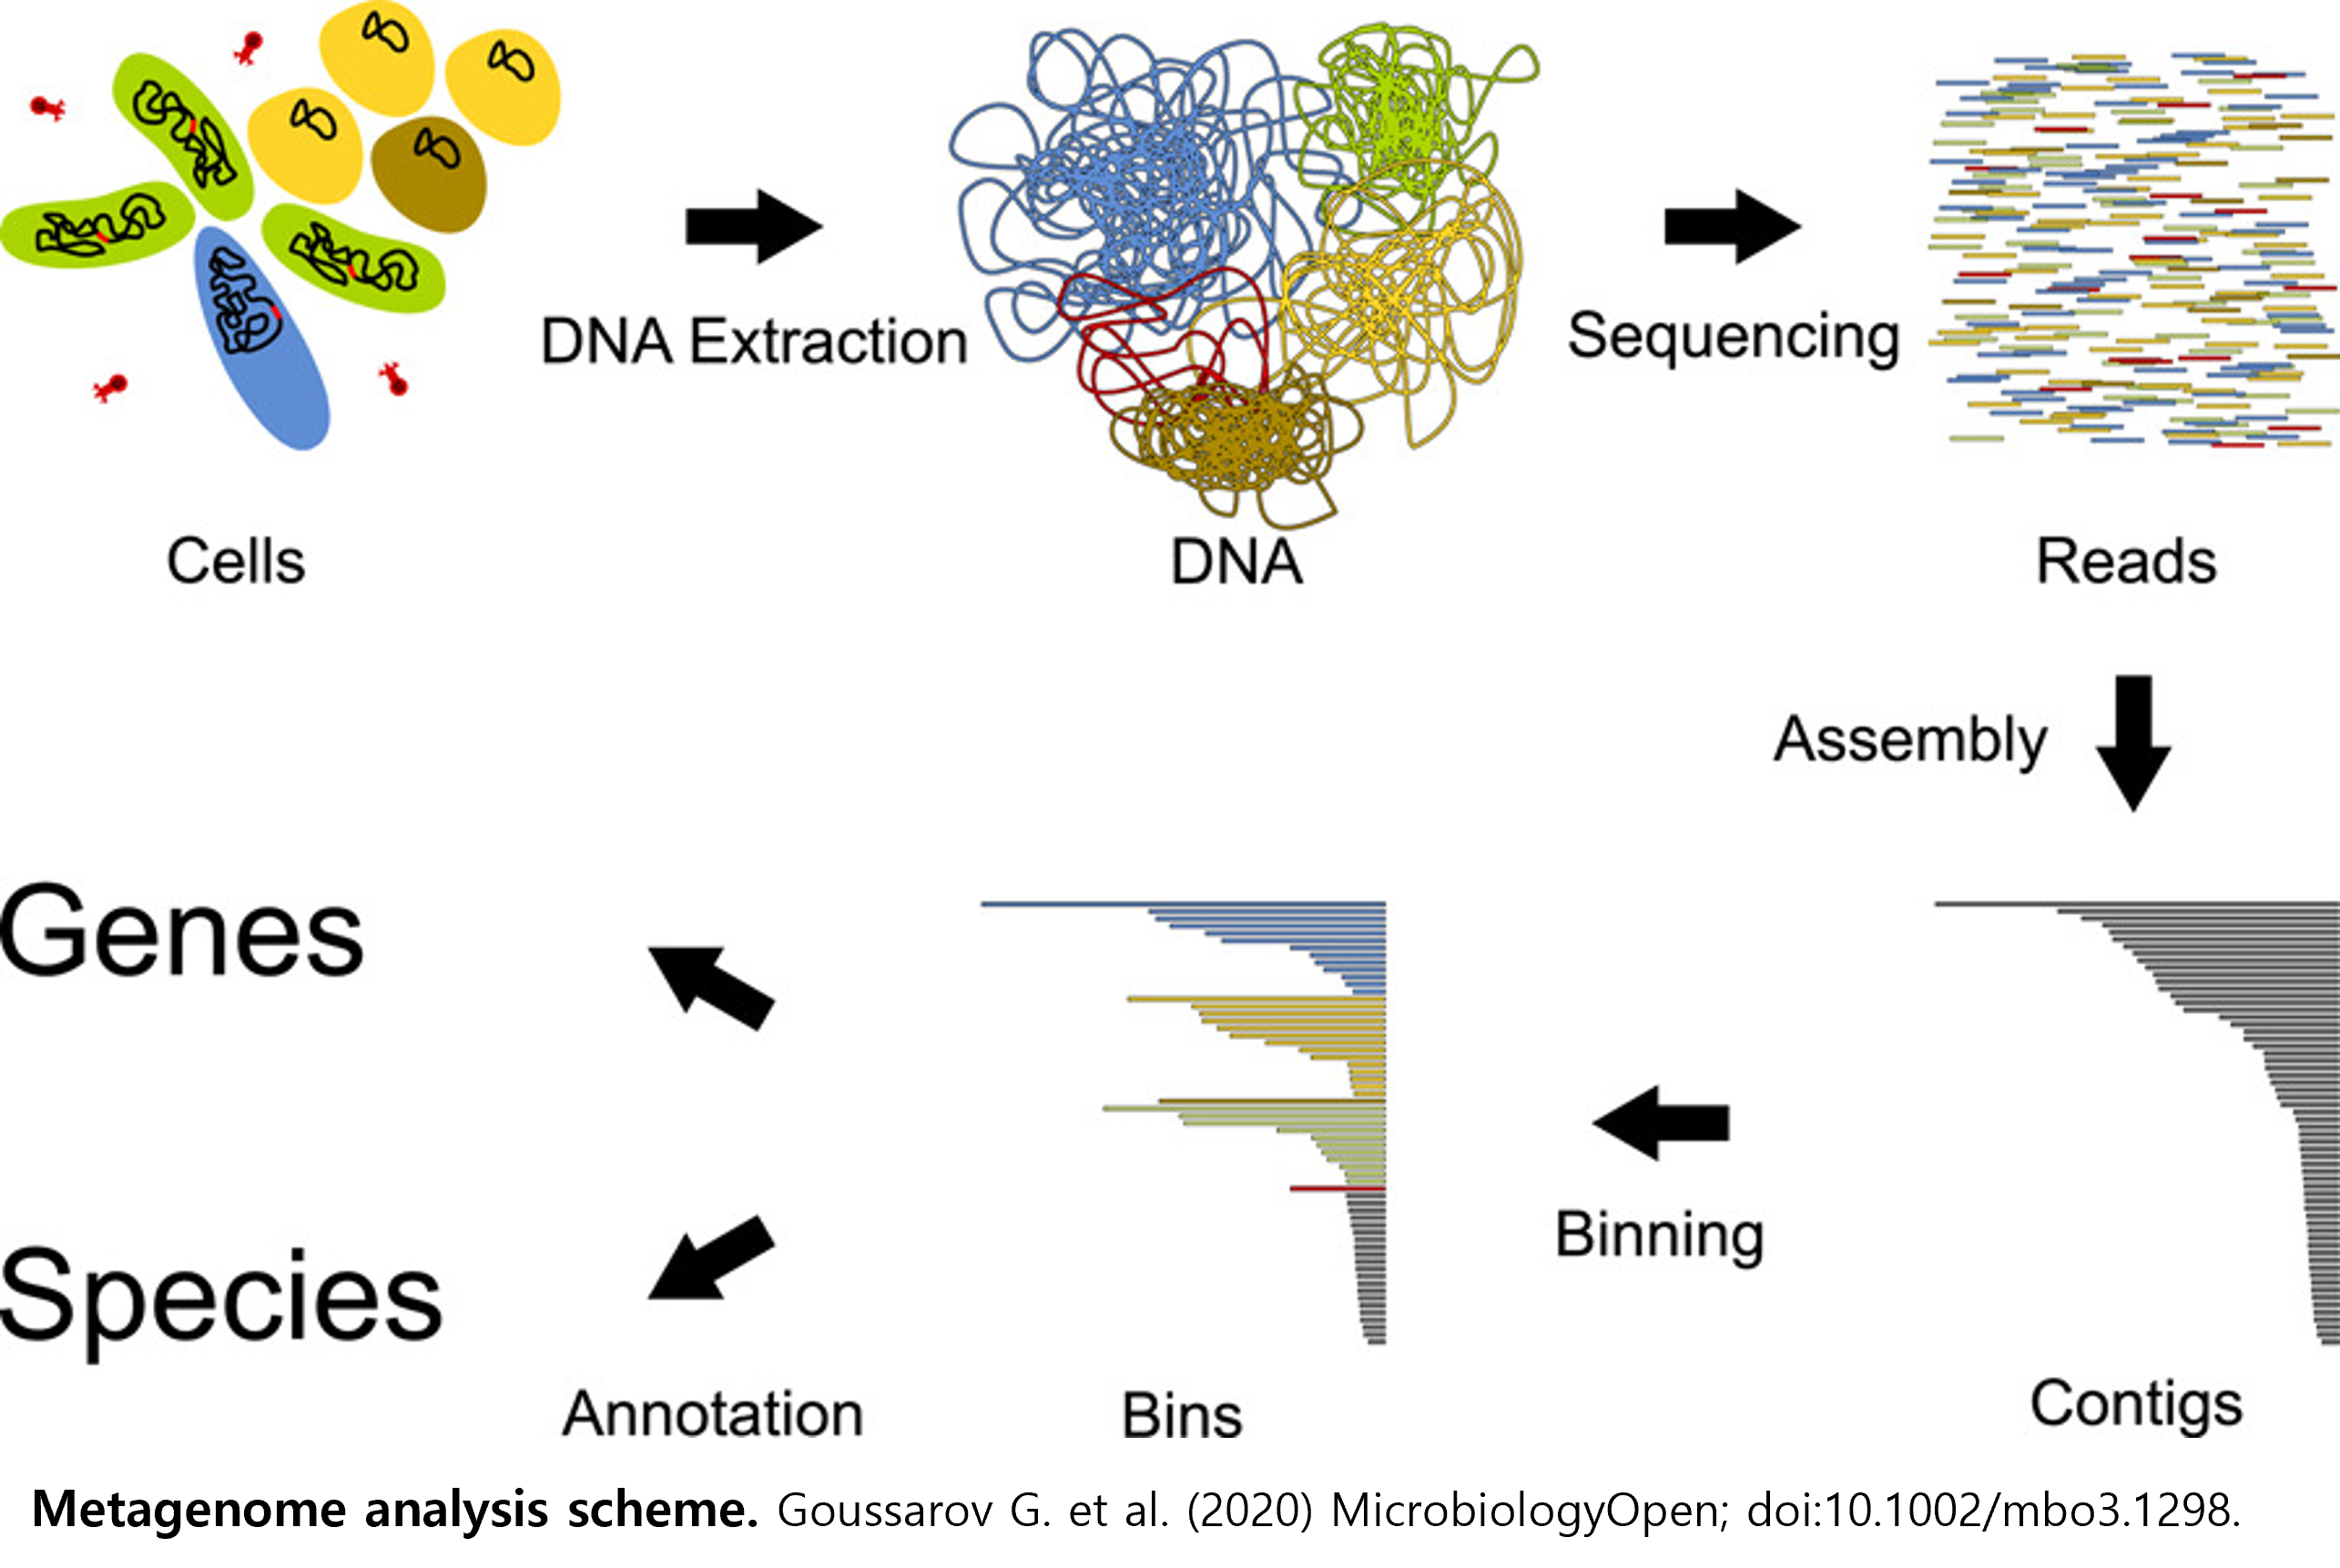
Public Analysis Pipelines

Pipeline Image

Metagenome Assembled Genome Analysis pipeline

The MAG (Metagenome-Assembled Genome) analysis pipeline is designed to reconstruct the genomes of uncultured microorganisms from complex microbial community sequencing data and to analyze them both taxonomically and functionally. The workflow consists of the following steps: quality control (QC), assembly, binning, refinement, quality assessment, taxonomic classification, and functional annotation. In the QC stage, the quality of the sequencing data is evaluated, and low-quality reads and host-derived sequences are filtered out. Next, MEGAHIT is used to assemble the cleaned reads into contigs, and the quality of the assembly is assessed using metaQUAST. The assembled contigs are then grouped into genome bins using MetaBAT2, MaxBin2, and CONCOCT, which cluster contigs based on similarities in nucleotide composition (e.g., GC content) and coverage patterns. Subsequently, DAS Tool integrates the results from multiple binning algorithms to remove redundancy and improve both completeness and purity, resulting in a refined set of high-quality MAGs. The completeness and contamination levels of the resulting MAGs are evaluated using CheckM2, while GTDB-Tk is employed for taxonomic classification. Finally, Prokka is used to perform functional annotation by predicting and annotating coding sequences within each MAG. This pipeline is executed independently for each sample (single-sample mode) and serves as a procedure for obtaining MAGs and conducting comprehensive functional analyses.
#MAG

Pipeline Image

Transcriptomic Alternative Splicing Analysis Pipeline

The RNA-seq Analysis Pipeline aims to process RNA-Seq data and perform statistical analyses of gene expression. This pipeline is designed to evaluate, refine, and interpret experimental data to understand gene expression levels, consisting of the following stages: quality control, read alignment, quantification, statistical analysis, and visualization. In the initial phase, the pipeline performs quality assessment and refinement of the raw sequencing data. FastQC is used to examine and evaluate the quality of experimental data, while Cutadapt efficiently trims sequencing adapters and removes low-quality reads. Next, STAR2 is employed to accurately align reads to the reference genome, allowing precise identification of each gene’s expression loci. Then, the FeatureCounts function from the Rsubread package assigns aligned reads to specific genes to quantify expression levels and generate a count matrix. In the following step, edgeR and limma both R-based tools are used to identify statistically significant differences in gene expression levels and analyze gene expression variation. It is important to note that each condition (control and test) must include at least two biological replicates for statistical analysis to be valid. Without replication, the residual variance becomes zero, leading to analysis failure or unreliable results. Additionally, fgsea (fast gene set enrichment analysis) is used to assess gene set enrichment, and various visualization tools are applied to effectively represent the results. Finally, using the output from fgsea, multiple R packages can be employed to further analyze and visualize experimental outcomes. Overall, the pipeline begins with RNA-seq raw data in FASTQ format, generates a FastQC report (fastqc.report.html) for quality assessment, and produces diverse visualization outputs?such as MA plots, correlation plots, networks, volcano plots, and heatmaps to visually interpret gene expression and enrichment results. The Bio-Express RNA-seq Alternative-Splicing Pipeline (AS) can identify five broad types of splicing patterns at the transcriptome level of gene expression. Alternative splicing generates multiple transcripts (isoforms) based on the combination of multiple exons (coding regions) that comprise a single gene. Consequently, even a single gene can produce proteins with different structures, allowing them to function as genes with distinct functions. This mechanism enables a wide range of protein capacities and enables diverse molecular roles. (Source: From Wikipedia, the free encyclopedia) The five most common types of events are as follows: 1. SE (Exon skipping cassette exon) 2. MXE (Mutually exclusive exons) 3. A5SS (Alternative donor site) 4. A3SS (Alternative acceptor site) 5. RI (Intron retention) The AS analysis pipeline proceeds as follows: 1. Quality Control: Sequencing quality control (by FastQC) 2. Trimming: Adapter and low-quality removal (by Cutadapt, Trimmomatic) 3. Mapping: Reference alignment (by STAR, HISAT2) 4. AS detection: Alternative splicing exploration (by rMATs) 5. Visualization: Visualization of AS results (by ggsashimi)
#RNA-seq
#Alternative-splicing
#transcriptome

Pipeline Image

Whole Genome Sequencing Somatic Variant Analysis Pipeline

The Bio-Express Somatic WGS Pipeline is a modular analysis pipeline designed to detect somatic mutations from whole-genome sequencing data. It takes raw FASTQ files as input and provides comprehensive somatic mutation calling results, quality assessment, and visualization based on tumor-normal pair analysis. After assessing sequencing quality with FastQC, adapter removal and quality trimming are performed using Cutadapt, followed by mapping to a reference genome sequence using the BWA-MEM2 alignment tool to generate BAM format alignment files. Subsequently, the GATK pipeline is employed for duplicate removal, mapping quality assessment, and filtering of low-quality reads, ensuring consistency of all pair information. Coordinate-based sorting is performed using SAMtools, and PCR duplicates are removed via GATK MarkDuplicates. Base quality score recalibration is then conducted using GATK BaseRecalibrator and ApplyBQSR, leveraging known variant site information as covariates. For the recalibrated BAM files, a comprehensive quality control and sample validation step is performed first. Sample relatedness is verified using Somalier, sample identity is confirmed through variant-SNP marker integration analysis with SNPmatch, sample contamination is assessed with VerifyBamID2, and coverage analysis is conducted using Mosdepth to comprehensively evaluate the quality and reliability of the sequencing data. Next, the pipeline proceeds to the tumor-normal pair analysis stage, where Normal-Tumor pair compatibility is verified and cross-sample contamination levels are estimated using Conpair. Single nucleotide variants and insertion/deletion mutations are detected in parallel using Strelka2 and Mutect2 to maximize the sensitivity and specificity of somatic mutation detection. Finally, tumor purity analysis is performed using TINC, structural variants are called with Manta, and copy number variation analysis is conducted with Canvas, quantifying comprehensive somatic genomic alterations to provide essential information for cancer genomics research and precision medicine. > Default genome: hg38 [IMPORTANT] Sample Type Identification Rule: - Tumor tissue samples: FASTQ filenames must contain "_T" - Normal tissue samples: FASTQ filenames must contain "_N" (e.g.) patient001_T_R1.fastq.gz # Tumor sample, Read 1 patient001_T_R2.fastq.gz # Tumor sample, Read 2 patient001_N_R1.fastq.gz # Normal sample, Read 1 patient001_N_R2.fastq.gz # Normal sample, Read 2
#wgs
#whole-genome sequencing
#somatic mutation
#tumor-normal pair analysis
#cancer genomics
#precision medicine

Pipeline Image

Whole Genome Sequencing Germline Variant Analysis Pipeline

The Bio-Express Somatic WGS Pipeline is a modular analysis pipeline designed to detect somatic mutations from whole-genome sequencing data. It takes raw FASTQ files as input and provides comprehensive somatic mutation calling results, quality assessment, and visualization based on tumor-normal pair analysis. After assessing sequencing quality with FastQC, adapter removal and quality trimming are performed using Cutadapt, followed by mapping to a reference genome sequence using the BWA-MEM2 alignment tool to generate BAM format alignment files. Subsequently, the GATK pipeline is employed for duplicate removal, mapping quality assessment, and filtering of low-quality reads, ensuring consistency of all pair information. Coordinate-based sorting is performed using SAMtools, and PCR duplicates are removed via GATK MarkDuplicates. Base quality score recalibration is then conducted using GATK BaseRecalibrator and ApplyBQSR, leveraging known variant site information as covariates. For the recalibrated BAM files, a comprehensive quality control and sample validation step is performed first. Sample relatedness is verified using Somalier, sample contamination is assessed with VerifyBamID2, and coverage analysis is conducted using Mosdepth to comprehensively evaluate the quality and reliability of the sequencing data. Subsequently, GVCF file generation using GATK HaplotypeCaller and germline SNV/Indel variant detection in standard VCF format using GenotypeGVCFs are executed. Following this, comprehensive variant statistical analysis using BCFtools is performed, and structural variants are detected using the Manta tool. > Default genome: hg38
#wgs
#whole-genome sequencing
#germline mutation
#individual genomic analysis

Pipeline Image

ChIP-seq Analysis Pipeline

The Bio-Express ChIP-seq Analysis Pipeline is a modular analysis pipeline designed to detect protein-DNA binding sites from Chromatin Immunoprecipitation Sequencing (ChIP-Seq) data. It uses raw FASTQ files as input and provides comprehensive epigenomic binding site calling results, quality assessment, and visualization based on transcription factor binding sites, histone modification regions, and chromatin structure analysis. After evaluating sequencing quality with FastQC, low-quality base filtering is performed using FASTX-Toolkit, followed by mapping to a reference genome sequence using the Bowtie2 alignment tool to generate SAM format alignment files. Subsequently, the preprocessed alignment files are used to enter the epigenomic signal analysis stage. Statistically significant peak calling is performed using MACS2 (Model-based Analysis of ChIP-Seq) to accurately identify protein-DNA binding sites, providing high-resolution binding regions in narrowPeak format. Finally, comprehensive downstream analysis is conducted using Homer. The annotatePeaks function provides genomic location annotations and nearby gene information for the detected peaks, and the makeUCSCfile function generates bedGraph and bigWig format visualization files compatible with the UCSC Genome Browser, enabling intuitive visualization of the genome-wide distribution patterns of chromatin immunoprecipitation signals. > Default genome: hg38 [IMPORTANT] Sample Type Identification Rule: - Control Files: Must start with "CONTROL_" (Required prefix for automatic identification) - Treatment/ChIP Files: No specific filename requirements (e.g.) CONTROL_input_R1.fastq.gz # Valid control, Read 1 CONTROL_input_R2.fastq.gz # Valid control, Read 2 ChIP_H3K4me3_R1.fastq.gz # Valid treatment, Read 1 ChIP_H3K4me3_R2.fastq.gz # Valid treatment, Read 2
#chip-seq
#protein-dna binding
#epigenomics
#tfbs
#transcription factor binding sites
#histone modification
#chromatin structure

Pipeline Image

Bacteria Assembly pipeline

The Bacterial Genome Assembly Pipeline is an automated pipeline that performs a one-stop analysis of bacterial WGS data, from QC to annotation. This pipeline is based on a program called ZGA and consists of several stages: read QC, read processing, de novo assembly, genome polishing, assembly QC, and annotation. It also has the advantage of allowing the analyst to specify the starting and ending stages for the analysis. The initial stages of the pipeline (Read QC and read processing) involve the quality assessment and refinement of the experimental data. fastp is used to inspect and evaluate the data quality, while BBDuk (from BBtools) is utilized to effectively remove sequencing adapters and low-quality reads. Additionally, the BBMerge step (also from BBtools) increases assembly efficiency by pre-overlapping the paired-reads. Finally, depending on the user's selection, Mash can be used to estimate the expected genome size. In the second stage (de novo assembly and genome polishing), de novo assembly is performed by selecting one of three assembly tools: Unicycler, SPAdes, or Flye. Following this, the assembled sequence is polished using the built-in functions of the respective tool to enhance the genome's quality. In the subsequent stage (Assembly QC and annotation), CheckM is used to verify the quality of the assembled genome by assessing its completeness, contamination, and heterogeneity. Finally, the Bacterial Genome Assembly Pipeline concludes by performing annotation on the assembled genome using Bakta. Overall, the pipeline allows for analysis starting from the primary input data—fastq-formatted bacterial WGS raw data—and proceeding through QC, de novo assembly, assembly QC, and annotation.
#Bacteria
#assembly
#de novo assembly
Bio-Express View User Guide

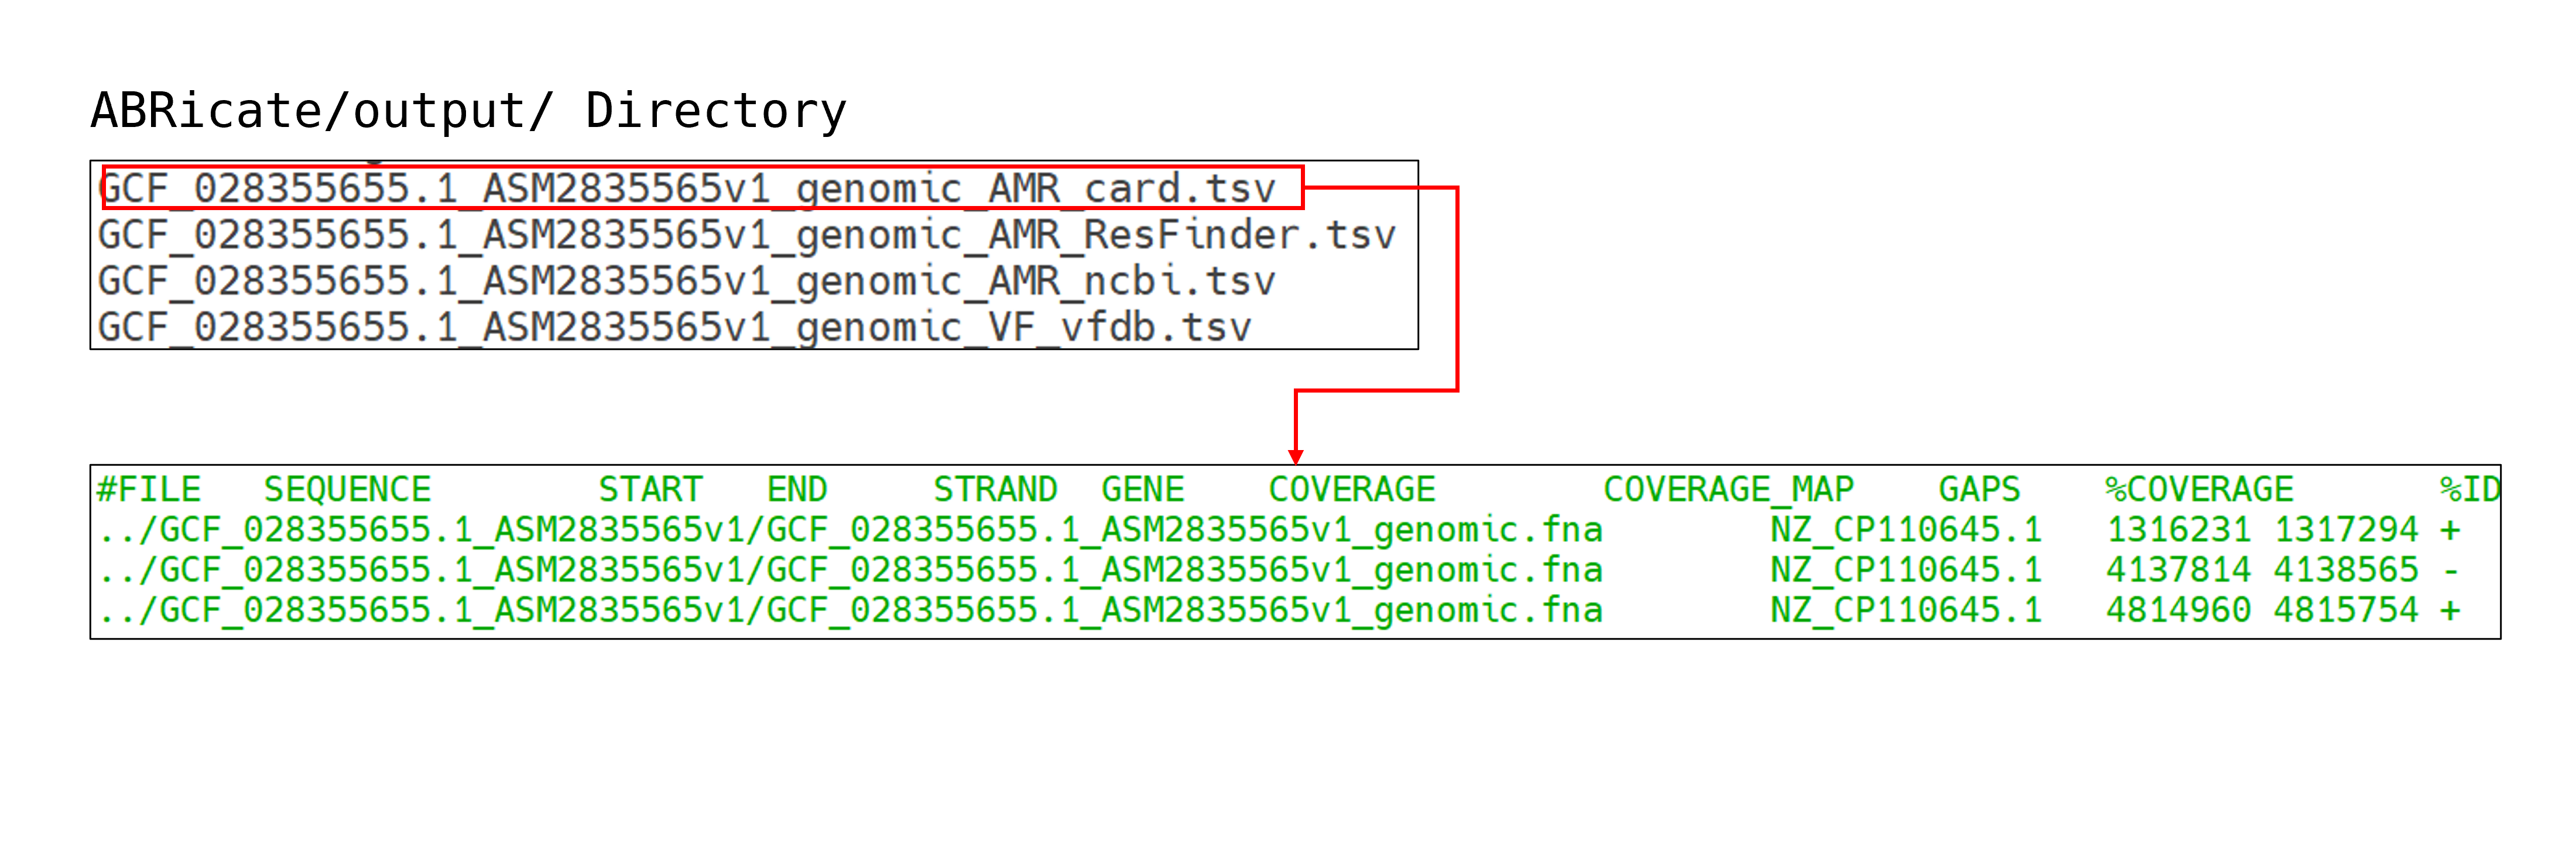
The BioExpress service is the only cloud-based integrated data analysis service in Korea that enables big data analysis in scientific fields through a dynamic container-based automated workflow analysis platform and high-speed data transfer service.

Download

Please download the workbench and high-speed transfer service for the OS that matches your environment.
- CLOSHA : Cloud-based Large-scale Genomic Analysis Platform - GBOX : High-speed transfer service for large amounts of data - SFTP : SSH Protocol-based Data Transfer Service

6,681

User

94,791cases

Execution Task
Korea BioData Station More

Bio research data refers to all types of data produced through national R&D projects in the life sciences field. As innovative research methods utilizing this data gain attention, bio data is emerging as a key factor driving R&D innovation. To support this, the National Bio Data Station has been established to integrate and provide data scattered across ministries, projects, and researchers, aiming to create a data-driven bio research environment.

Registration Status by Data Type

  • 2,433cases

    Bio Project
  • 163,038cases

    Bio Sample
  • 2,393,058cases

    Registered Data

Bio Project Registration Status

Cumulative Number of Registrations(cases)
National Genome Project More

Bio big data, which forms the foundation of precision medicine, is becoming increasingly important as the focus shifts from post-treatment care to personalized treatment and preventive healthcare. Particularly in the bioindustry, which benefits from first-mover advantages, proactive investment is necessary, and major countries are building large-scale bio big data systems. Therefore, this project was launched to build national bio big data for leading future healthcare. The goal is to establish a foundation at the national level to collect, store, and utilize 'bio big data', the center of the precision medicine era, and to contribute to the promotion of new industries and the improvement of healthy lives.

Collection of Clinical Information

Designating and operating 16 rare disease collaboration institutions to recruit rare disease patients and collect clinical information.

Data Analysis

Transporting the collected rare disease patients' samples to resource production institutions for the production and analysis of genomic data.

Data Sharing

The collected clinical information and genomic data are shared through a consortium formed by three institutions.

Data Utilization

The analyzed data is used for rare disease patient counseling, diagnosis, and research activities.

Genomic Data 25,000
Variant Analysis Data 25,000
Clinical Information 25,000
Cohort 7
Infectious Disease Data Portal More

The Infectious Disease Data Portal is a portal service that integrates and provides research data on infectious disease viruses from around the world.In a rapidly changing environment, to understand infectious diseases and develop treatments and vaccines, KOBIC integrates and provides global infectious disease research data to share data and results harmoniously.

Sequence Dashboard

88,386 Domestic Genomic Sequences
1,354 Domestic Protein Sequences
19,685,177 Overseas Genomic Sequences
35,837,682 Overseas Protein Sequences
19,764,289 COVID-19 Genomic Sequences
35,333,179 COVID-19 Protein Sequences
Virus

Provides integrated information on viruses including disease overview, particle and genomic structure, life cycle, epidemiology, mutations, etc.

Data

Provides quality-analyzed genomic and protein sequences, and protein structures collected from around the world.

Statistics

Offers various statistical services on virus data, such as outbreak timing, region, mutations, etc.

Analysis Tools

Simple web-based BLAST service for infectious disease standard genomic sequences.